Reports
Use Reports when you need an Excel report for a selected period or a reusable table view for a specific set of indicators.
Your account must have reporting access, and you need access to at least one plant. The available plants and report actions depend on your account.
Standard reports
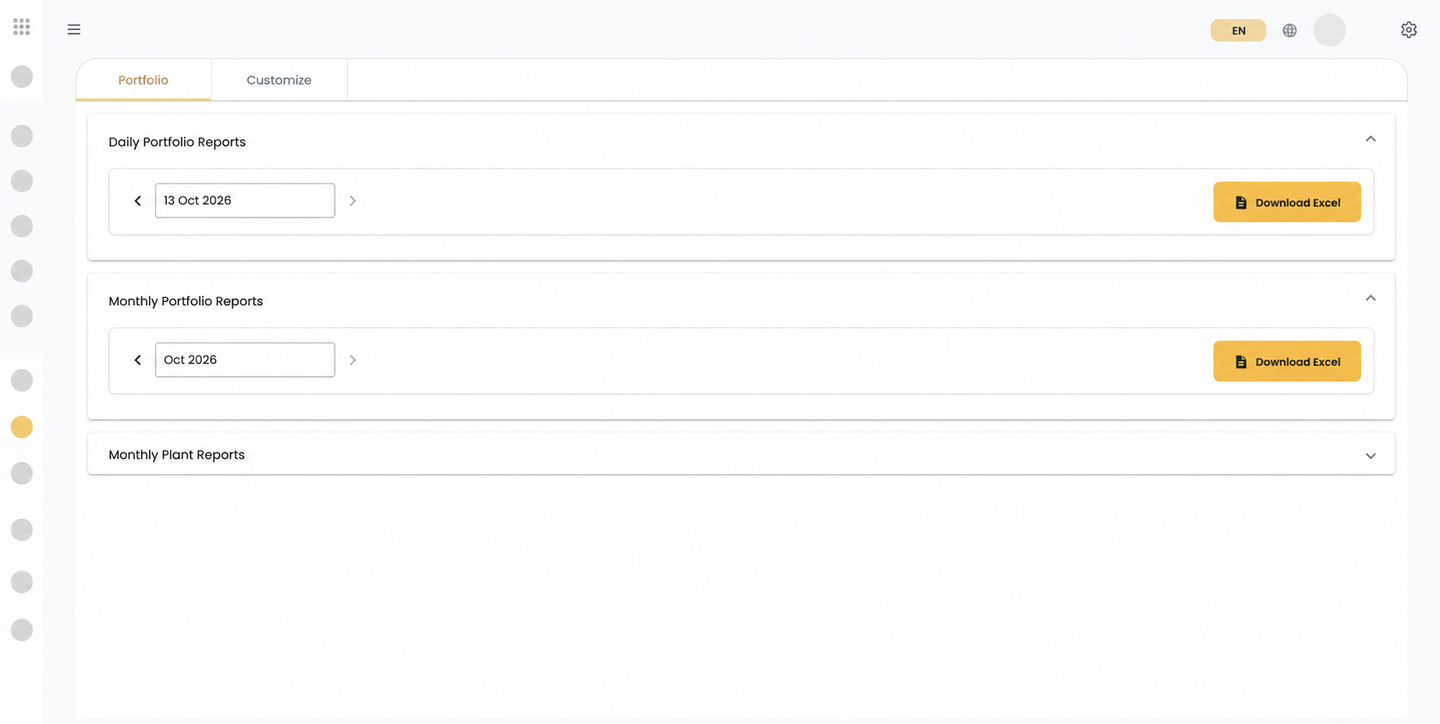
Section titled “Standard reports”Open Reports → Portfolio. The page provides these report flows:
| Report flow | Plant scope | Period | Action | Output |
|---|---|---|---|---|
| Daily Plant Reports | One plant | One day | Download Excel | Plant daily report |
| Daily Portfolio Reports | Portfolio available to you | One day | Download Excel | Portfolio daily report |
| Monthly Portfolio Reports | Portfolio available to you | One month | Download Excel | Portfolio monthly report |
| Monthly Plant Reports | One or more plants | One month | Start report generation | Plant monthly report, prepared in Tasks |
Generate a standard report
Section titled “Generate a standard report”- Open Reports and choose Portfolio.
- Select the report section you need.
- Choose the plant, date, or month.
- Select Download Excel or start the monthly plant report.
Monthly plant reports are prepared in the background. Open Tasks to follow progress and download the finished file. Preparation time varies. A failed task shows an error state; review your selection and try again if the action is available.
Opening a single plant’s report requests refreshed results. In a portfolio report, a plant with no usable data is listed as skipped and the report carries on with the others; it fails only when none of the selected plants can produce a report.
Customized reports
Section titled “Customized reports”Use Reports → Customize to save a view that contains the indicators you need most often.
Create a customized report
Section titled “Create a customized report”- Select Add Report.
- Enter a short, meaningful name.
- Choose a report type:
- Plant Report
- Inverter Report
- Meter Report
- Choose a period:
- Minute — 5-minute interval
- Day — 1-hour interval
- Month — 1-day interval
- Year
- Select the indicators to include. Indicators that do not support the selected period are unavailable.
- Select Save Report.
The available indicators depend on the report type and period. Depending on that selection, the list can include yield, power, irradiation, performance ratio, availability, overspill, soiling, meter readings, inverter status, and electrical values.
Open and use a saved view
Section titled “Open and use a saved view”The Customize list shows each saved report’s name, period, type, configuration, and created date. Select the open action to view it, or delete a saved report you no longer need.
Inside a view:
- Choose the date or period to inspect.
- Select the plants to include.
- Review the table generated from the saved configuration.
The table columns follow the indicators in the saved definition. Monthly views can also show a last-data-update field when that information is available.
Customized views read the data available for the selected plants and period. The view definition does not guarantee that every selected indicator has a value for every row.
Understand report status and data boundaries
Section titled “Understand report status and data boundaries”Standard monthly plant generation can move through these states:
| Status | Meaning | What to do next |
|---|---|---|
| Pending | Waiting to be processed. | Check later in Tasks. |
| Progress | The report is being generated. | Wait for completion before downloading. |
| Success | The report is ready. | Download the completed file. |
| Failure | Generation did not complete. | Review the selection and try again if the action is available. |
| Revoked | The task was cancelled. | Start a new report request only if the report is still needed. |
The status reflects report-generation work, not the completeness of every upstream data source. If a report is empty, unavailable, or older than expected, check the selected period and plant scope first, then contact your SolarSENS administrator.
See Data freshness and corrections for the difference between source-data freshness, calculation completion, report preparation, and refreshing a view.
Use Where calculated results appear when comparing a report field with Operation Overview, Plant, or analytical views.
Related workflows
Section titled “Related workflows”- Portfolio and Operation Overview for fleet-level operational review
- Plant Monitoring for plant and device inspection