String Analytics
Use String Analytics to find the strings in a plant that perform worse than their neighbours, and to see whether the pattern repeats over several days. Access depends on your role and subscriptions, and on the plant having string configuration and data.
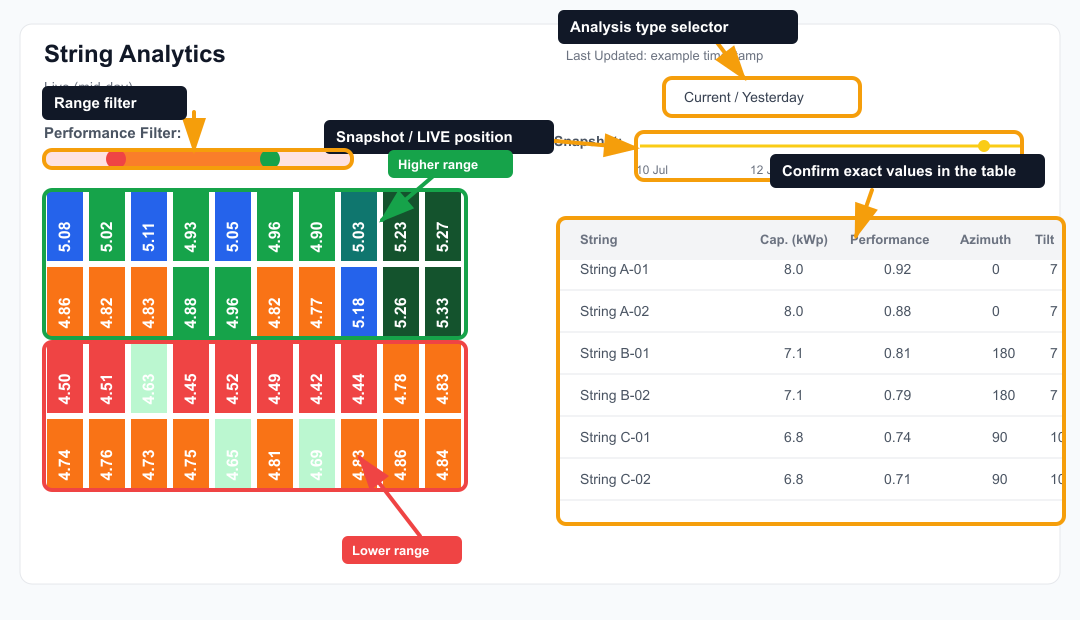
The example is illustrative. It shows how the map, filter, timeline, and table work together.
Find strings to inspect
Section titled “Find strings to inspect”- Open Insights → String Analytics.
- Select the plant and an analysis type.
- Check the context shown: Azimuth, Last Cleaned, Referenced Date, and Last Updated.
- Choose a day with the position slider, or select LIVE for the current position.
- Start with the lower-score colour bands on the map. Use the range filter to show only the scores you want.
- Move along the snapshot timeline to see whether the same strings keep appearing.
- Confirm the details in the string table, comparing strings with similar capacity, azimuth, and tilt.
Choose an analysis type
Section titled “Choose an analysis type”| Analysis type | What it shows | Use it when |
|---|---|---|
| Current / Yesterday | String current from the most recent completed day in the selected snapshot | You want to spot unusually low or high current before checking device status and telemetry. |
| Normalized Power / Yesterday | Production compared with capacity taken into account | You want the main comparison across strings of different sizes. |
| Cleaning / Relative After Cleaning | Performance relative to the last cleaning, where available | You want to see whether performance changed after cleaning. Shown in the current view only. |
Keep the analysis type fixed while you compare. Changing it can change the ranking even when the plant and day stay the same.
Current and past days
Section titled “Current and past days”Past days appear on the slider only when the plant has stored results for them. A past day is shown on today’s plant layout. A string that exists now but didn’t on that day can show a blank or unavailable value.
Read the string table
Section titled “Read the string table”| Field | How to use it |
|---|---|
| String | The string’s name or label in this plant. |
| Cap. (kWp) | Its configured capacity. |
| Performance | A score for ranking strings within the same plant, analysis type, and day. |
| Azimuth (°) | Its orientation. |
| Tilt (°) | Its module tilt. |
The Performance score is a triage signal, not a measurement. A low score tells you which strings to inspect; on its own it doesn’t prove a disconnected string, a hardware fault, or an energy loss, and it can’t be converted into energy or money. A blank or very low value is something to investigate, not a measured zero.
A pattern that repeats over several days points to a persistent problem. A one-day dip is more likely shading, soiling, or weather.
Confirm the cause
Section titled “Confirm the cause”Before you assign a cause or a maintenance action, compare the same period with device status, alarms, cleaning history, and detailed telemetry. Check timestamps: a device may be offline now while String Analytics still shows an earlier day. Device health, alarms, and string performance explains how the three differ.
Export
Section titled “Export”String results. Select the CSV export to save the current result. Note the plant, analysis type, reference date, position, and Last Updated time with it, so someone else can reproduce your comparison.
Inverter heatmap. For performance by time and device in a spreadsheet:
- Open Insights → Heatmap.
- Select a plant, device type, period, and date.
- Choose Yield, Specific Yield, or Temperature, then select Generate.
- Select Export heatmap as CSV.
The file has one row per time bucket and device, with the columns Time Bucket, Device, S. Yield (kWh/kWp), Yield (kWh), and Temperature (°C). Its filename includes the plant, period, device type, selected date, and when you exported it.
If something looks wrong
Section titled “If something looks wrong”Opening String Analytics doesn’t recalculate anything or refresh reports. If a day’s result looks wrong because its source data was incomplete, note the plant, date, analysis type, position, and Last Updated time, and look at the same view again once the data has been corrected. Data freshness and corrections explains how corrections flow through.