Dashboard and filters
Use the work-order list to manage the daily queue, and Analytics to review workload, backlog, and risk across plants.
Review the queue
Section titled “Review the queue”The list opens showing New work from the last 30 days.
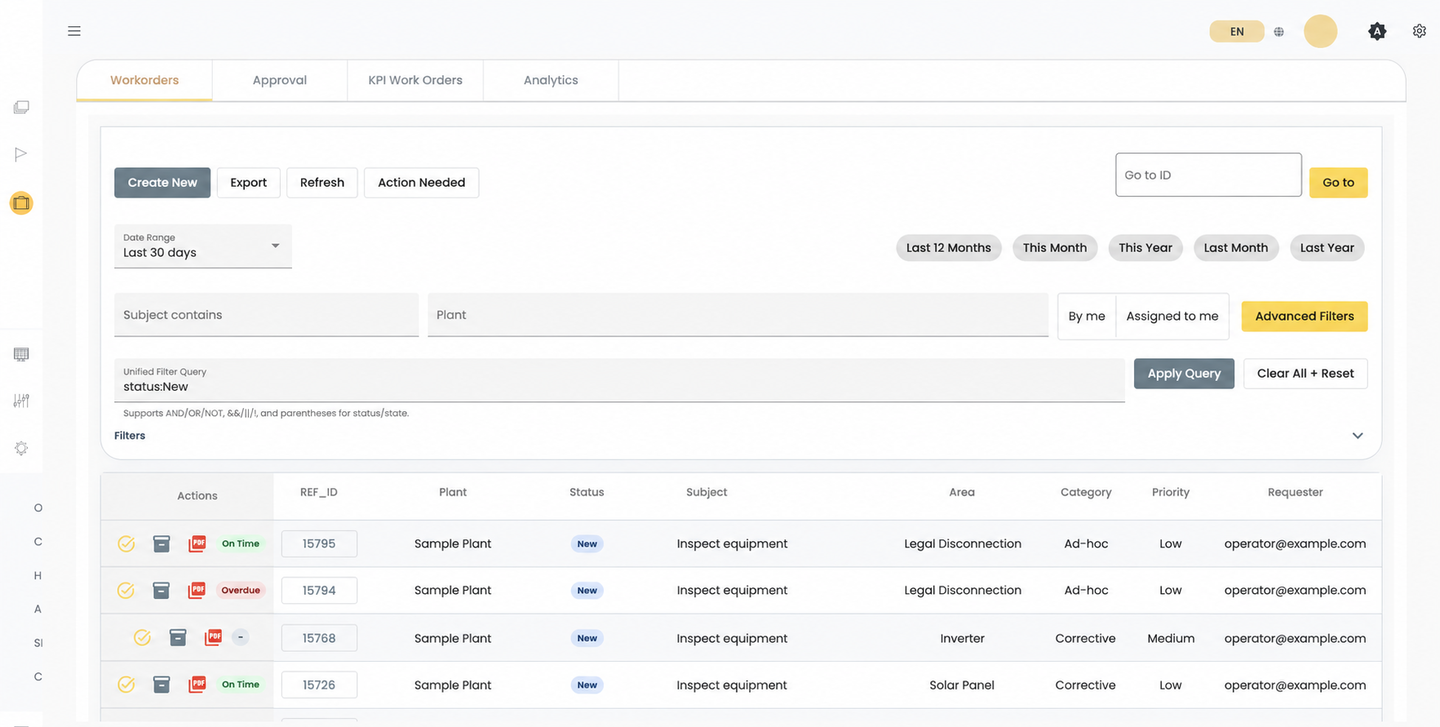
- Narrow the list by plant, date, status, priority, or owner.
- Use
Newto find unassigned work, andAssignedto review work that has an owner. - Add
Overdueor a date range to focus on aging work. - Open Analytics for duration, backlog, loss, workload, or throughput across plants.
- Share the page link when a colleague needs the same filtered list.
Filters
Section titled “Filters”- date range and subject
- plant
- the By me and Assigned to me shortcuts
- status:
New,Assigned,Resolved, orArchived - state:
Draft,Published,On Time,Overdue, orClosed - area, category, and priority
- requester and assignee
- combined conditions, to build a query from several filters
- Reporting, for one or more report months
Reporting finds work assigned to a reporting period. Each work order in a report month also shows that month as a chip.
Share a filtered list. The page address keeps your filters, so you can bookmark it or send it to a colleague. There are no named saved filters.
You only see work orders for plants you can read, whatever the filters say.
Analytics
Section titled “Analytics”Analytics is available to admin and supervisor users. It shows:
- work created and man-hours
- median and P90 duration
- open backlog and potential loss
- status, category, and area breakdowns
- aging
- plant risk
- resource load, and workload from requester to assignee
- throughput per assignee
Filter Analytics by date, plant, area, category, and priority. Where offered, choose ALL to match every condition or ANY to match at least one.
Work order lifecycle explains what each status and state means.