Portfolio Overview now raises a Needs cleaning finding when a significant share of a plant’s capacity is due for cleaning, based on each inverter’s last eight weeks. The finding shows the share that is due and lists the affected inverters, for example Clean now: 38% of plant capacity due (I06, I07, I08), and closes when the plant no longer meets that condition. After a cleaning, the finding updates from the first week of new data instead of waiting eight weeks. See Use Cleaning Analytics.
Enhancements
EnhancementCleaning Analytics table · Monitoring — Site Overview now shows 1-week and 4-week values for Soiling Rate and Performance, and shows ”-” when a comparison is not available.
EnhancementPortfolio map · Monitoring — The map now opens focused on visible plants, with controls and the irradiance legend kept clear.
EnhancementAlarm Analytics · Operations — Alarm Analytics now presents results in the selected plant’s local time.
Fixes
FixInsights charts · Monitoring — Fixed Insights charts remaining visible after empty or failed queries because earlier results were not cleared, and missing samples displaying as an unbroken line.
FixAlarm recovery · Operations — Fixed cleared device and inverter alarms remaining open when a clear arrived soon after creation because it could be processed before the alarm occurrence existed.
FixPortfolio map refresh · Monitoring — Fixed the Portfolio map changing position after weather information loaded.
Site Overview now offers optional Total PR and Total Corrected PR columns alongside the existing performance measures. Operators can sort, export, and review these values in the expanded site detail.
Billing reviews can now show an inverter-yield breakdown for a plant result. This helps teams compare the plant total with the underlying inverter data.
Enhancements
EnhancementDataHub exports · Operations — DataHub datasets can now include Corrected PR and total irradiation. Monthly irradiation labels are also clearer.
EnhancementString review · Monitoring — String results now use their assigned inverter grouping, making inverter-level comparisons easier to review.
Fixes
FixPortfolio daily yield · Monitoring — Fixed the Portfolio summary and chart showing different yield values by aligning their daily-yield values.
FixMeter-based billing yield · Operations — Fixed HSN billing results losing available solar or meter yield when an adjusted value was unavailable.
FixDaily meter totals · Operations — Fixed incorrect import or export totals when a meter reported a synthetic zero at the next midnight boundary.
FixPartial-plant performance · Monitoring — Fixed missing daily and realtime performance results for partial plants by continuing their station-data processing path.
Portfolio Analytics now flags invalid inverter-yield results and missing String snapshots in the fleet view. Operators can use these findings to focus their investigation on the affected plant and reporting date.
Teams can now submit and review KPI exclusion removals as WorkOrder change requests, separately from standard approval work. Each request remains at plant scope, giving the change a clear operating boundary.
Daily Meter Reading can now show HSN-adjusted meter yield, and the Daily Export column uses the same adjusted solar yield. This gives billing and operations teams a consistent adjusted value where HSN applies.
Enhancements
EnhancementPortfolio review · Monitoring — Portfolio filters now stay in the page link, making a selected fleet view easier to reopen or share.
EnhancementAction Center access · Operations — Users with access to a plant can now review its alarms and Analytics action items.
Fixes
FixDaily inverter yield · Monitoring — Fixed inflated end-of-day yield where a previous day’s inverter counter was still present during the first readings after reset.
FixLoss analysis · Monitoring — Fixed unavailable grid or set-point readings being treated as usable values, which could distort overspill and soiling loss results.
FixWorkOrder times · Operations — Fixed WorkOrder picker and creation times shifting around daylight-saving changes by preserving the plant-local time.
From Portfolio Overview, operators can open the related String Analytics or Daily Meter Reading view in a new tab without leaving an Analytics finding. Linked meter-reading views select the relevant plant and draw attention to the affected dates.
Enhancements
EnhancementAnalytics finding filters · Operations — Choose more than one finding type at a time, with common data and string conditions selected when the view opens.
EnhancementCleaning recommendations · Monitoring — Needs-cleaning findings now show the current and four-week soiling rates when those values are available.
EnhancementAnalytics finding context · Operations — String-status counts, variance context, and the time evidence was last checked are clearer on each finding.
EnhancementPortfolio Overview access · Monitoring — The beta Portfolio Overview is now available from the sidebar.
Fixes
FixResolved Analytics findings · Operations — Fixed resolved or fully handled findings remaining in the active list after the supporting evidence was updated.
FixDaily loss results · Monitoring — Fixed daily loss results going missing for plants without overspill data because an optional processing input stopped the final calculation.
FixModule-temperature status · Monitoring — Fixed module-temperature status values differing from the daytime average used in performance processing.
Action Center now groups Analytics findings by plant and affected date, making repeated conditions easier to review. Operators can filter by plant and sort findings by occurrence, first appearance, plant, or number of affected dates.
Enhancements
EnhancementAction Center navigation · Operations — Plant choices are listed alphabetically, and compact date rails make finding history quicker to scan.
EnhancementPortfolio weather context · Monitoring — Portfolio heat tiles now use measured irradiance averaged over 30 minutes for a more representative regional view.
Fixes
FixAnalytics plant filter · Operations — Fixed Analytics findings not changing after a plant was selected because the filter control did not send the selection.
FixAction Center refresh · Operations — Fixed the plant list disappearing during an Action Center refresh retry.
FixAlarm identification · Operations — Fixed alarms without a device label appearing without a useful identifier.
FixCleaning Analytics charts · Monitoring — Fixed lower chart metrics missing from Cleaning Analytics when updated results were published.
FixSaved irradiance views · Monitoring — Fixed saved irradiance views failing to refresh after an access session expired.
Action Center now groups repeated device alarms and shows their recurrence history and frequency trend. This gives operators the context to distinguish a one-off alarm from a condition that is returning.
Portfolio Overview now uses current fleet data for its summary and map. The map also provides weather layers with playback controls, so teams can review changing weather context alongside their sites.
Teams can now review DataHub diagnostic issues in Action Center, request a supported repair, and follow its progress and result. Completed repairs retain their history and show when another attempt is available.
Enhancements
EnhancementAlarm inbox · Operations — Alarm metrics, lifecycle cues, and grouped history are clearer while new arrivals continue to appear during background loading.
EnhancementPortfolio weather context · Monitoring — Current irradiance remains visible at portfolio zoom, with less marker clutter and a heat-tile view for broad fleet views.
Fixes
FixDaily loss analysis · Monitoring — Fixed an issue where Daily Loss Analysis could produce no final-loss results when irradiance data was unavailable, caused by an optional curtailment estimate stopping the overall calculation.
FixDaily inverter yield · Monitoring — Fixed incomplete reported daily totals caused by the closing boundary value being omitted from an inverter-yield upload.
FixPortfolio data and weather layers · Monitoring — Fixed Portfolio totals and weather layers not refreshing reliably when viewing current conditions.
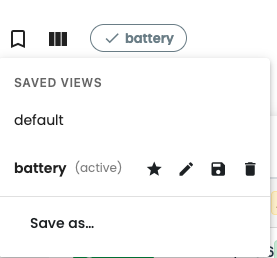
Save the columns, sort order, and filters you use in the plants overview, then reopen, rename, overwrite, or delete the view. Up to three views can be pinned beside the table title for one-click access, and your last-used view follows you across devices.
Enhancements
EnhancementBilling workbook detail · Operations — Daily sheets now include opening and closing cumulative meter registers, while monthly sheets distinguish cumulative registers from consumption calculated across the billing period.
EnhancementLoss overview comparison · Monitoring — The overview table now includes Potential Generation, while budget yield and planned losses use the uploaded expected-production values consistently.
EnhancementBattery strategy readability · Monitoring — Charge and discharge windows now appear in a dedicated lane below the day performance chart, with clearer time labels and status presentation.
EnhancementPlants overview layout · Monitoring — Table columns, cells, and status indicators are aligned more consistently, while exported spreadsheets follow the visible columns and their displayed order.
Fixes
FixMonthly reports · Operations — Fixed individual plant reports reopening with stale results and portfolio reports failing when one selected plant has no usable data.
FixBilling meter direction · Operations — Fixed Tariff, Import, and end-of-day register values appearing in the wrong direction for configured swapped meters, including first-day and zero-movement rows.
FixGrid and load values · Monitoring — Fixed missing, stale, or reversed grid and load values caused by meter-direction handling, transient cumulative dips, timestamp alignment, and incomplete daily boundaries.
FixPlant performance charts · Monitoring — Fixed incorrect monthly PR values, an inconsistent default yield series, and battery strategy windows shifting when the plant and viewer use different time zones.
FixBudget irradiation uploads · Operations — Fixed monthly expected-irradiation values being multiplied by the number of days in the month.
Storage-enabled plants now show battery power, state of charge, energy, availability, and latest-update details in cards, lists, fleet summaries, and charts. Monthly and yearly charts also show battery charge and discharge energy.
The day power chart now shows when the fixed-period strategy permits charging or discharging. Readings outside the permitted windows are highlighted so operators can investigate unexpected battery activity.
Work orders can now be filtered across multiple report months, with each record showing its report month. Timelines provide compact summaries and expanded details for recorded changes.
Reporting users can now generate a monthly workbook for the full portfolio available to them, with plant-level worksheets included in the output.
Enhancements
EnhancementDataHub plant metrics · Monitoring — Plant-level metrics are now grouped for faster selection, with sensor-accumulated and effective irradiation shown as separate fields.
EnhancementOverview layout · Monitoring — Overview charts, device lists, axis titles, and controls now remain aligned and readable across available layouts.
EnhancementInverter alarm details · Operations — Inverter alarm records now provide clearer fault names and additional troubleshooting context.
Fixes
FixString Analytics snapshots · Monitoring — Fixed historical snapshot dates shifting away from the date selected in the user’s browser.
FixGrid energy totals · Monitoring — Fixed missing grid import and export totals when valid cumulative meter readings were available.
FixSoiling loss values · Monitoring — Fixed soiling losses displaying with the wrong sign or disappearing after report rounding.
FixDaily performance results · Monitoring — Fixed performance-ratio results around midnight using data from the wrong reporting period.
Select a reference inverter when generating a billing workbook to include its daily summary data and review the source behind inverter-level billing figures.
Enhancements
EnhancementInsights CSV timestamps · Monitoring — Insights CSV exports now include a timestamp column in your browser’s local time for easier comparison with the on-screen analysis.
EnhancementIrradiation in loss analysis · Monitoring — The loss waterfall now plots irradiation on a separate axis with point markers, while the accompanying table shows irradiation first with corrected units and formula guidance.
Fixes
FixInsights filter persistence · Monitoring — Fixed selected portfolio, country, period, date, display, and view filters resetting after refresh, and older waterfall results replacing the latest selection.
FixResolved work-order exports · Operations — Fixed attachments added through the current work-order workflow being omitted from resolved work-order PDF exports.
FixPerformance-ratio input labels · Monitoring — Fixed plant device tabs showing default PR inputs instead of the configured energy source, irradiation source, and weather-station averaging method.
FixManagement yield selection · Monitoring — Fixed saved yield preferences being applied inconsistently across management charts and summaries.
FixBilling meter totals · Operations — Fixed reversed import and export readings, incorrect daily deltas, and monthly closing-rate values affecting billing results.
FixDaily meter readings · Monitoring — Fixed intermittent zero or sharply lower cumulative meter readings inflating or reversing daily import, export, and consumption totals.
FixDaily PR irradiation · Monitoring — Fixed daily performance-ratio results using an inconsistent irradiation reading when several raw daily values were available.
FixOn-screen help · Monitoring — Fixed help tooltips not opening on device, control, plant-layout, and performance views.
Plant Information and device tabs now show which energy and irradiation inputs are used for performance ratio calculations, including weather-station averaging and configured weights.
Enhancements
EnhancementManagement yield totals · Monitoring — Management views now default to aggregated inverter yield for users who have not saved a preference. Saved preferences continue to apply.
EnhancementAlarm type clarity · Operations — Alarm Analytics now lists AVA Fault separately from vendor Fault so operators can distinguish the original alarm types.
Fixes
FixAlarm Analytics results · Operations — Fixed instantaneous alarms being omitted and negative alarm durations appearing in results.
FixGoodWe inverter alarms · Monitoring — Fixed missing GoodWe inverter alarms when several status flags were reported together.
FixDaily performance ratio · Monitoring — Fixed daily PR results being unavailable for plants without a soiling model when the required production and irradiation inputs were present.
FixAlarm Analytics freshness · Operations — Fixed newly processed alarm results being hidden by outdated cached responses.
Plant Overview charts now support selecting individual power meters with meter selection for overview charts. The selection persists across sessions. Month/Year views show daily/monthly yield summaries for the selected meter.
Insights → Heatmap now has an Export as CSV button, exporting in wide layout with one row per time-bucket and device, including Yield, Specific Yield, and Temperature columns.
Enhancements
EnhancementMeter accuracy improvements · Monitoring — Charts and billing now use raw full-day meter register deltas for selected power meter views, improving accuracy. Subplant power meter charts also use daily meter energy. A cumulative meter fallback direction is preserved.
EnhancementString bulk edit improvements · Config Server — String Configuration bulk edit now preserves plant selection across page navigation. Configurator meters table layout has been fixed and EVN field options are now sorted naturally.
Telemetry correction workflow has been significantly overhauled: upload immutable correction plans, resume prepared runs from deep-linked run IDs, and track status with status chips and expiry timestamps. Correction initiators are now visible in history view.
Wind speed and broader weather station telemetry are now available as chartable data series in the Charting module.
Enhancements
EnhancementAlarm category search · Monitoring — Alarm category filtering now includes search functionality for quicker navigation through alarm categories.
FeaturePlant reference temperature · Config Server — The device configurator now supports editing reference temperature per plant.
EnhancementDatahub selected date boundaries · Monitoring — Datahub export now correctly preserves selected date boundaries during export and interaction.
EnhancementString Configuration fixes · Config Server — Plant picker overlap in String Configuration has been fixed and low-current strings are now flagged in SVG string diagrams.
Fixes
FixPipeline fix · Platform — Fixed pipeline issue affecting some legacy plants, resulting in missing expected-power line charts and incomplete data in SolarSENS charting.
SolarEdge inverter alarms are now supported in Monitoring.
Enhancements
EnhancementString Configuration enhancements · Config Server — Added plant search filter, URL-persisted plant selection, and fixed MPPT/Input SVG name parsing to use Name instead of AvaName.
Added support for backfilling historical telemetry data from the Huawei FusionSolar API.
Enhancements
EnhancementDevice list improvements · Config Server — Device list dialog now includes text search and Modbus ID multi-select filter. The “+N more” devices chip expands into a virtual-scroll dialog for large device sets.
Week 25 (Jun 12–19)
Fixes
FixIEC 104 polling fix · Monitoring — Fixed IEC 104 reading issues in the EVN-378 monitoring view by implementing dynamic polling intervals per source type.
New sunburst/donut chart showing logger connection status (Connected/Disconnected/Unknown) with an ops-style detail table including telemetry columns (Logger, Mode, Grid, PV, Reactive Power, Yield). “Agg by plant” toggle collapses to plant-level, persisted via URL query param.
New EVN 378 tab in Operations Overview with an ECharts cartesian heatmap showing logger connection status (24h/7d/30d views) from Cloudflare Analytics Engine data. Includes plant/logger filter and custom date range selection.
Workorder export rebuilt as a job-based async system with count preview, progress polling, and cancel support. CSV download switched to FileSaver blob fetch for reliable cross-origin S3 downloads. State machine dialog with progress bar and copyable 24-hour link.
New contractor permission gating system. “Create New” and “Add Work Order” buttons now respect user permissions. New settings page for parent-scope admins to manage contractor permissions.
Replaced the 14-day slider stub with an 8-day slider for String Analytics time-travel views.
Enhancements
EnhancementDate input UX improvements · Operations — Date input fields changed from datetime-local to text format with “YYYY-MM-DD HH:mm” placeholder. New impact/shutdown field component with copy support.
Fixes
FixSlider performance fix · Monitoring — Fixed no-op slider events causing UI hangs during drag (was re-running response application ~30x/sec on every mouse-move).
EnhancementMeter sum fixes · Monitoring — Fixed discrepancy in daily values and monthly billing response rounding for float columns. Added meter location grouping support.