Use Cleaning Analytics
Cleaning Analytics shows which plants are losing energy to soiling, how fast it is getting worse, and when each plant is likely to need cleaning. Use it to build a short, defensible cleaning list from a whole portfolio, then confirm that the work paid off.
Open it from Insights → Cleaning Analytics. It has two tabs:
- Overview ranks every plant in a portfolio.
- Plants shows the trend and weather context for one plant.
Before you start
Section titled “Before you start”- Access. Cleaning Analytics appears in the menu when your account includes the feature and you can access at least one eligible plant. If you do not see it, ask your SolarSENS administrator.
- Cleaning history. Record each completed cleaning in the system your organization uses. SolarSENS uses the latest recorded cleaning as the starting point for the soiling trend, the Last Cleaned column, and the Last Clean view.
1. Find the candidates
Section titled “1. Find the candidates”- Select Overview and choose a Portfolio.
- Read the summary cards to see how large the problem is.
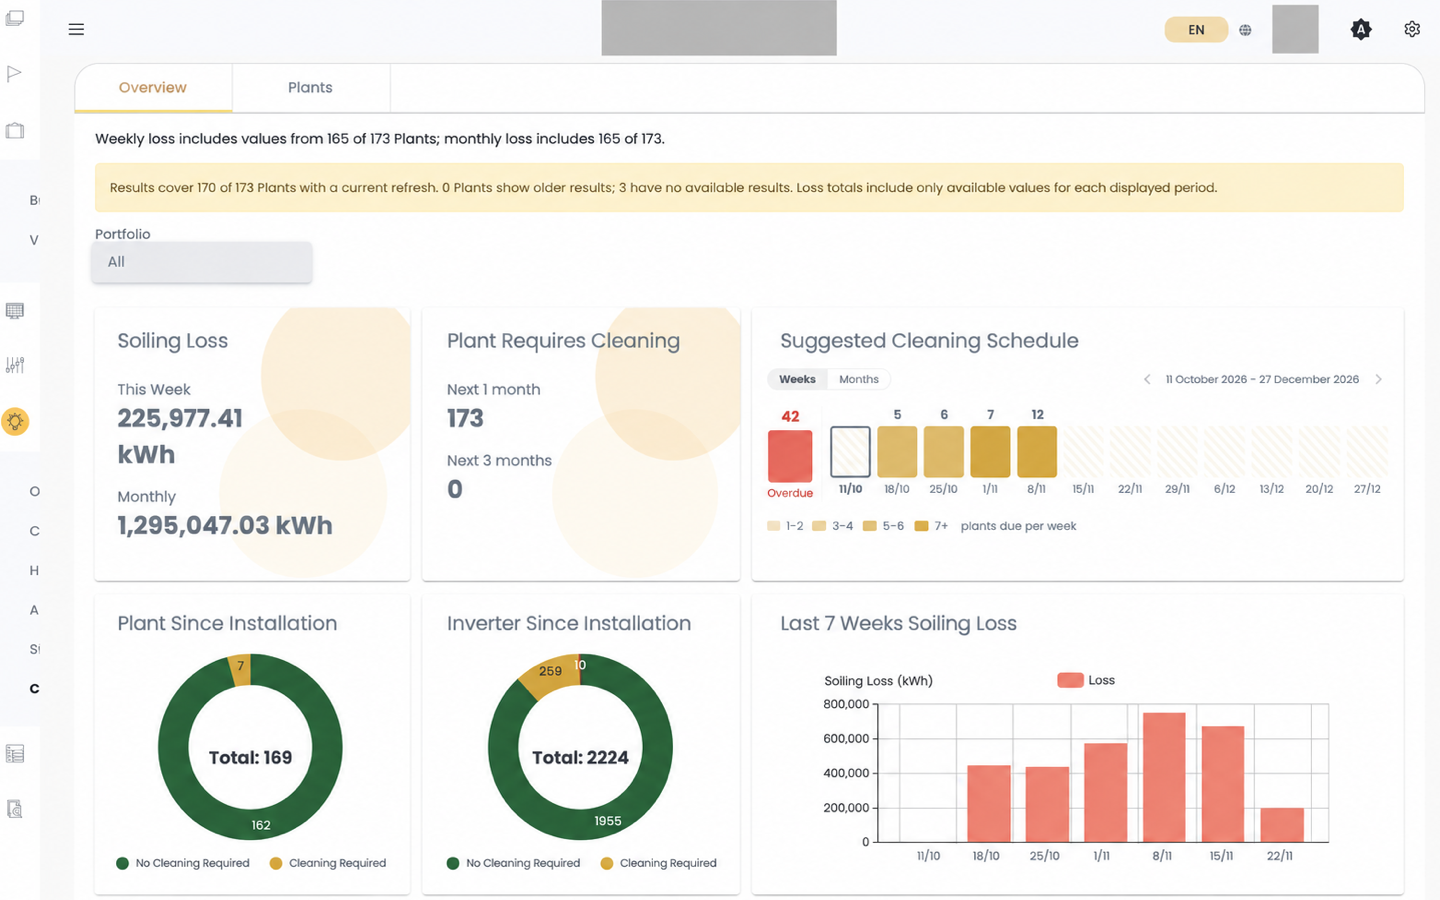
| Card | What it answers |
|---|---|
| Suggested cleaning | How many plants are expected to need cleaning in the Next 1 month and the Next 3 months. |
| Soiling Loss | How much energy the portfolio has lost to soiling this week and this month. |
| Plants and inverters | How many are Clean, Dirty, or V. Dirty right now. |
| Specific soiling loss | Whether the loss over the last seven weeks is a one-week spike or a sustained trend. |
The cards cover different periods: weekly, seven-week, and month-to-date. Compare a value only with another value from the same period.
2. Rank the plants
Section titled “2. Rank the plants”Use the Site Overview table to decide which plants to look at first. Select a column heading to sort.
| Column | How to use it |
|---|---|
| Status | Start with V. Dirty, then Dirty. The status reflects the plant’s latest weekly soiling loss. |
| Inverters status (V | D | C) | Check whether a few inverters or the whole plant drive the status. |
| Soiling Rate | Compare the 1-week and 4-week values. A 4-week value close to the 1-week value means the soiling is sustained, not a one-week dip. |
| Performance | Compare the 1-week and 4-week values and the change from the previous week. Higher is better. A sudden drop can be dust after a storm. |
| Last Cleaned | Check whether the decline started after the latest recorded cleaning. |
| Suggested Cleaning | See when the plant is expected to reach its cleaning point. |
| Eval. Date | Confirm that the result is recent. |
| Soil. Loss | Compare estimated energy lost to soiling across plants. |
| S. Soil. Loss | Compare that loss per unit of plant capacity, so large and small plants rank fairly. |
A plant with a high S. Soil. Loss, a sustained 4-week Soiling Rate, and a near Suggested Cleaning date is a strong candidate.
To share the shortlist, select the download action to export the table as CSV. To check a plant, double-click its row.
3. Check the evidence for a plant
Section titled “3. Check the evidence for a plant”- Select Plants, or double-click a row in Site Overview.
- Choose the plant.
- Set Interval to 3 Months or 6 Months for recent behavior. Use 1 Year or All to compare several cleaning cycles or to see through a noisy period.
- Read the soiling chart against precipitation and humidity. Rain usually lowers soiling; a long dry period usually raises it.
- Read the normalized performance chart against irradiance and module temperature. A drop on low-irradiance or very hot days is a weather effect, not soiling.
- Find the cleaning markers on the timeline. Performance should step up after each cleaning and then decline gradually.
- Switch Relative To from Timeline to Last Clean to see only the period since the latest cleaning.
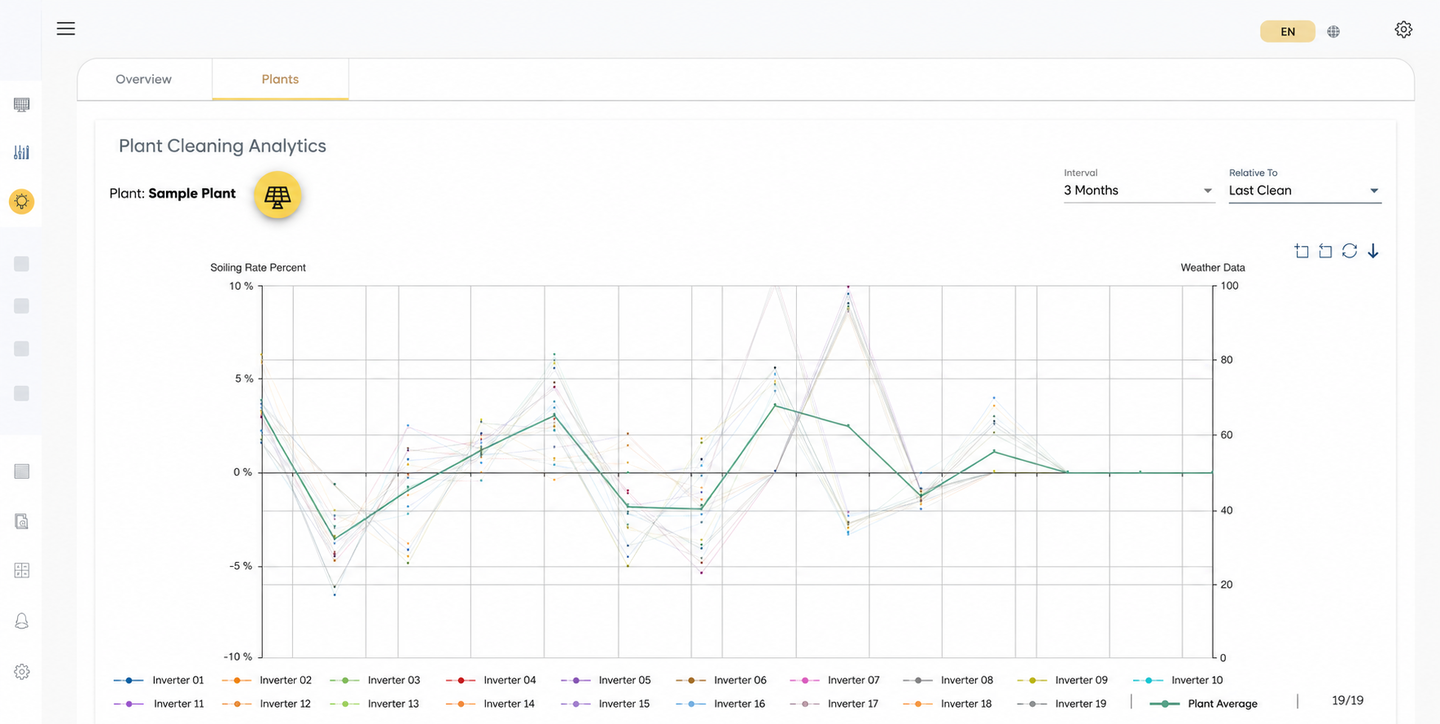
Normalized performance is shown relative to the best week in the selected interval. Changing the interval can change the values, so compare plants with the same interval.
4. Decide whether to clean
Section titled “4. Decide whether to clean”Add a plant to your cleaning plan when:
- the 4-week soiling rate confirms the 1-week value;
- the decline is not explained by weather, low irradiance, outages, or curtailment;
- the estimated loss is large compared with other candidates; and
- the latest cleaning date in SolarSENS is correct.
The suggested date estimates when soiling reaches the cleaning point. It does not take crew availability, site access, weather safety, or cleaning cost into account, and it does not create a work order. Plan the work through your organization’s normal process.
The suggested date can move as each new week of data arrives. Check it again shortly before the planned cleaning.
5. Confirm the result after cleaning
Section titled “5. Confirm the result after cleaning”After the cleaning is recorded and at least one week of new data is available:
- Open the plant in Plants.
- Set Relative To to Last Clean.
- Check that performance stepped up and the soiling rate fell.
If performance does not recover, soiling was not the main cause. Look for other losses, such as faulty strings, shading, or inverter derating, in Performance and Loss Analysis.
Needs cleaning findings in Portfolio Overview
Section titled “Needs cleaning findings in Portfolio Overview”SolarSENS also raises a Needs cleaning finding in Portfolio Overview when a significant share of a plant’s capacity is due for cleaning. The finding lists the share of capacity that is due and the affected inverters, for example: Clean now: 38% of plant capacity due (I06, I07, I08). It closes when the plant no longer meets that condition.
The finding looks at each inverter’s performance over the last eight weeks. The Status column in Site Overview looks at the plant’s latest week. Because of this, a plant can show Clean in Site Overview and still have a Needs cleaning finding. Use the listed inverters as the starting point for step 3.
When a value is missing
Section titled “When a value is missing”A blank value means SolarSENS does not have enough valid data to calculate it. It does not mean the plant is clean. Common causes are:
- the plant was cleaned recently and does not yet have enough new data;
- the plant had outages or data gaps in recent weeks; or
- the plant is not in the selected portfolio.
Check Eval. Date and try a longer interval. If the value is still missing or out of date, contact your SolarSENS administrator. For how SolarSENS treats missing, zero, and corrected values, see Data freshness and corrections.
Related
Section titled “Related”- Cleaning and soiling analytics explains each indicator.
- Performance and Loss Analysis compares soiling with other losses.
- Plant Monitoring helps you investigate a plant’s devices.