Availability and loss analysis
Availability tells you how much of a plant’s capacity was able to run. The loss bridge tells you how much energy each factor is estimated to have cost. Use them together, on the same plant and period, to explain a performance gap. The views you can open depend on your role and subscriptions.
Availability and energy-loss attribution explains how both are calculated.
Compare availability
Section titled “Compare availability”- Open Operation Overview → Performance.
- Select a portfolio, and a country if you need to narrow the plants.
- Choose Month as the period type, and Availability as the parameter.
- Choose the month and select Generate.
- Use the legend to compare plants. Select Download CSV to take the chart data further.
Availability is a percentage, weighted by inverter capacity where that information is set up.
Investigate the loss bridge
Section titled “Investigate the loss bridge”- Open Insights → Overview.
- Choose Portfolio or Plant, then select it, and a country where offered.
- Choose Month or Year. For a year, pick the month or quarter breakdown.
- Select the period.
- Read the waterfall, then use the table to compare plants.
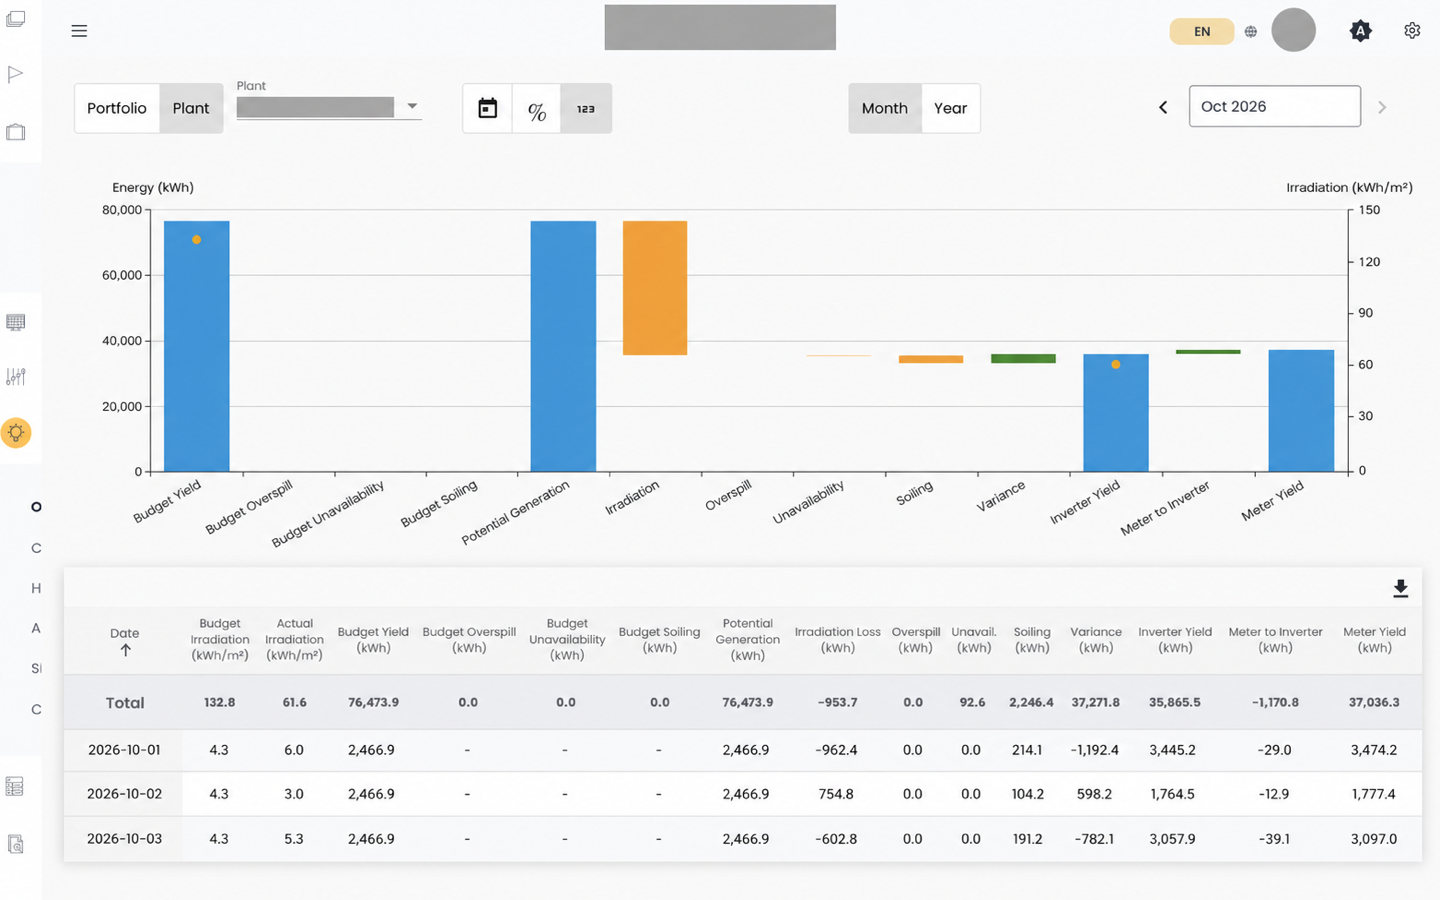
The waterfall steps from budgeted energy to metered energy:
| Step | What it shows |
|---|---|
| Irradiation | Estimated energy lost or gained because sunlight differed from budget |
| Overspill | Estimated energy not delivered during curtailment |
| Unavailability | Estimated energy lost while equipment couldn’t run |
| Soiling | Estimated effect of soiling, from the plant’s soiling model |
| Variance | The remainder no category explains. A signal to investigate, not a cause. |
| Meter to Inverter | The difference between inverter yield and metered yield |
How the loss bridge is composed explains each estimate.
Irradiation is drawn against the right-hand axis with point markers, so it stays distinct from the energy bars on the left-hand axis.
Keep or share a view. The page address keeps the portfolio, country, period, date, display mode, and analysis view, so you can refresh or share it without rebuilding the comparison. CSV exports include a timestamp column in your browser’s local time, to match what you see on screen.
Show values or percentages
Section titled “Show values or percentages”Use the display controls to show energy values, percentages, or both. For percentages, pick the denominator that fits your question:
- Budget Yield measures each step against the original budget.
- Potential Generation measures each step against the expected generation after budget allowances.
The denominator changes the percentage, not the energy behind it. Note which one you used when you share a screenshot or export.
Read unavailability both ways
Section titled “Read unavailability both ways”Compare availability percent with unavailability loss in kWh for the same plant and period. Two plants with similar availability can lose very different amounts of energy, because the downtime fell at different times of day or affected different capacity.
Neither number tells you the cause. Check the same period in the plant’s telemetry and in Alarm Analytics.
If something looks wrong
Section titled “If something looks wrong”- A value is blank, zero, or has changed. See Missing, zero, stale, and corrected values. Never add values across different plants, periods, or units.
- The comparison still doesn’t make sense. Ask your administrator or support to check the plant’s operating window, inverter capacity information, and data coverage. Send them:
- the portfolio or plant, and country
- the view, period, and date
- the availability percentage or loss step, with its unit
- the percentage denominator
- a screenshot or CSV export
- any missing irradiation, power, status, meter, or configuration data you noticed