Alarm Analytics
Use Alarm Analytics when the alarm list isn’t enough: to find which alarm types keep coming back, which devices they hit, how long they last, and how much energy they’re estimated to cost. To acknowledge or clear alarms, go back to Alarm Triage.
Find recurring alarms
Section titled “Find recurring alarms”- Choose a start and end date, and optionally a minimum and maximum hour. The default hours are 06:00 to 18:00.
- Select one or more plants, or keep the fleet selection to compare sites. You only see plants your account can access.
- Filter by alarm type, status, severity, or plant. Combine filters for a focused question, such as “Which critical inverter alarms occurred at Plant A during operating hours?”
- Use Aggregated View to spot alarm types and devices that repeat.
- Switch to Raw View to see the individual alarms behind a pattern.
- Read Energy Loss together with Remarks to judge the impact.
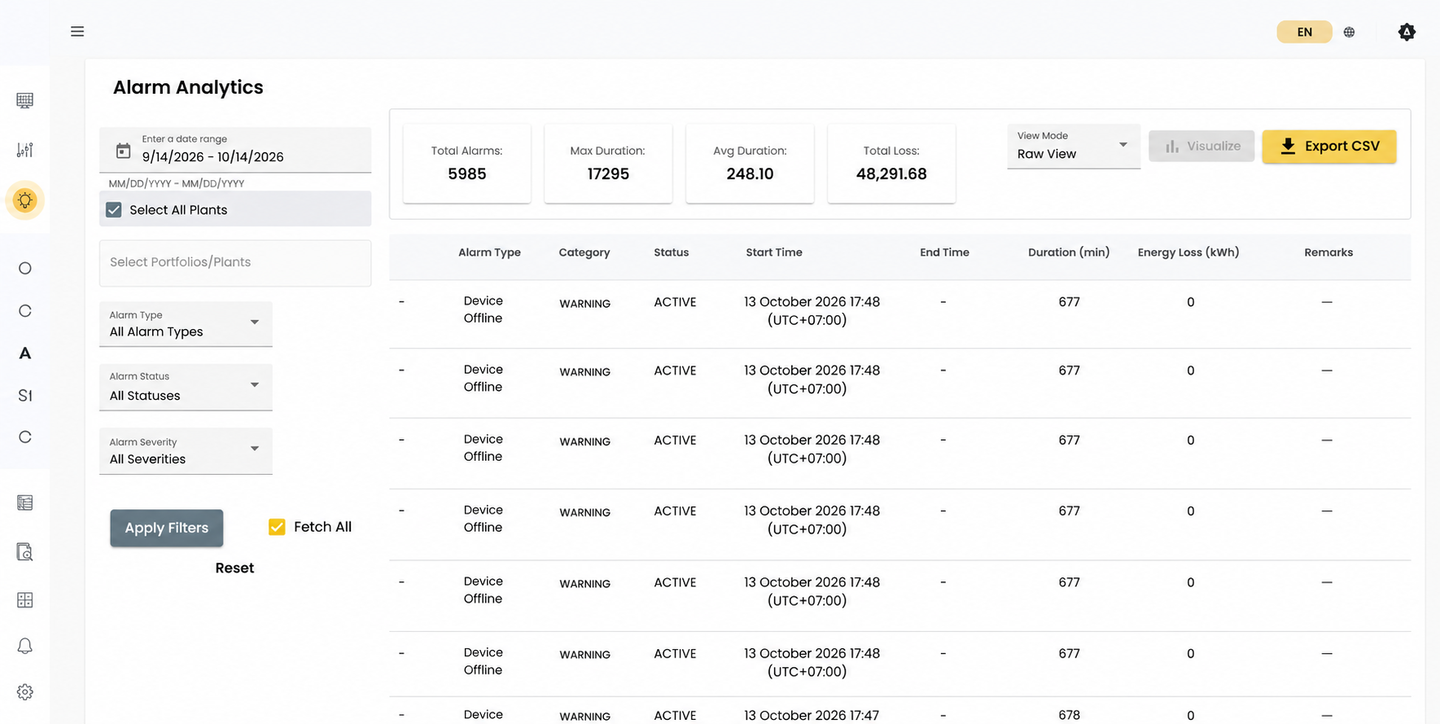
Raw and aggregated views
Section titled “Raw and aggregated views”| View | One row per | Use it to |
|---|---|---|
| Raw View | Alarm | Inspect individual events and their context. |
| Aggregated View | Group of alarms | Compare frequency across alarm types, devices, and plants. |
The two views offer different columns. Show or hide optional columns with the column selector, where available.
Raw View can show the device label and model, plant, alarm type and category, status, start and end time, duration in minutes, energy loss in kWh where available, and remarks explaining why loss wasn’t calculated.
Aggregated View shows the same context plus Alarm Freq, the number of alarms in the group. A high frequency means more when you keep the date, device, plant, alarm type, duration, and status in view.
A few things to know when reading durations and types:
- AVA Fault and the vendor’s Fault are separate alarm types. Keep the alarm-type column visible to tell them apart.
- An alarm that starts and clears at the same moment still counts as one interval, so it stays visible.
- If a device reports a clear time earlier than the start time, the duration shows as zero rather than negative.
How energy loss is estimated
Section titled “How energy loss is estimated”Energy loss is an estimate of the energy an alarm cost, not a meter reading. It doesn’t replace the alarm’s status or duration. SolarSENS estimates it only for alarms on inverters during operating hours, where there is enough five-minute data.
For each five-minute interval the alarm overlaps:
- Expected power comes from irradiance and the plant’s performance model.
- Actual power is
0for outage-type alarms such as grid outages and frequency events, and the recorded Active Power for derating-type alarms. - Loss for the interval is
max(0, expected − actual) × 5 ÷ 60kWh.
The alarm’s energy loss is the sum across all its intervals.
When no loss is calculated
Section titled “When no loss is calculated”If any interval in the alarm hits one of these conditions, the whole alarm’s energy loss is set to 0 and Remarks says why:
| Condition | Remarks |
|---|---|
| No soiling model for the plant’s date range | soiling model |
| No irradiance data for the time window, common at night | irradiance |
| The alarm is Device Offline | device offline |
| No Active Power data, for any other alarm type | active power |
Device Offline alarms don’t get an estimate. Grid outages get one only when none of these conditions apply, such as in daylight with irradiance data.
Examples
Section titled “Examples”These use illustrative numbers for one 125 kW inverter.
Grid outage in daylight. A 30-minute grid outage from 10:00 to 10:30. Expected power is 100 kW; actual power is 0 kW.
- Per interval: 100 kW × 5 ÷ 60 = 8.33 kWh
- Alarm total: 6 intervals × 8.33 kWh = 50 kWh
Derating. The inverter derates to 80 kW for 15 minutes while expected power is 110 kW.
- Per interval: (110 − 80) kW × 5 ÷ 60 = 2.5 kWh
- Alarm total: 3 intervals × 2.5 kWh = 7.5 kWh
Grid outage after sunset. An outage from 17:50 to 19:05. There’s no irradiance, so the alarm shows Duration 75 min, Energy Loss 0, and Remarks irradiance.
Read Energy Loss with Remarks
Section titled “Read Energy Loss with Remarks”| Energy Loss | Remarks | What it means |
|---|---|---|
| A positive value | Blank, or extra context | The estimate found a loss. It doesn’t tell you the cause. |
0 | A reason, such as irradiance | No estimate was possible. Don’t read it as zero impact. |
0 | - or blank | You can’t tell from the view whether the impact was zero or not estimated. This is common for non-inverter alarms and alarms outside operating hours. |
| Blank or unavailable | Possibly a reason | No estimate is available in this view or export. |
Views and exports don’t always show these states the same way. Never fill a missing value with your own estimate.
If an impact looks wrong
Section titled “If an impact looks wrong”- Narrow to the plant, alarm type, and period.
- Check the alarm’s status, duration, and device.
- If a zero or blank is unclear, check the plant’s and device’s data coverage for the same period.
- Open String Analytics where the plant and equipment support it.
Alarm Analytics shows processed results for comparison. Device health, alarms, and string performance explains how they relate to live alarms and work orders.