Portfolio and Operation Overview
Use Portfolio and Operation Overview to find the plant that needs attention today, then open it in Plant Monitoring. The plants, tabs, and actions you see depend on your account’s access.
Find the plant that needs attention
Section titled “Find the plant that needs attention”- Open Portfolio.
- Narrow the view with the portfolio, country, date, and site controls.
- Select a slice of the site status chart to filter the site table to plants in that state.
- Open Operation Overview to compare sites, devices, alarms, or performance side by side.
- Select a site in the Site Overview table to open it in Plant Monitoring.
Portfolio
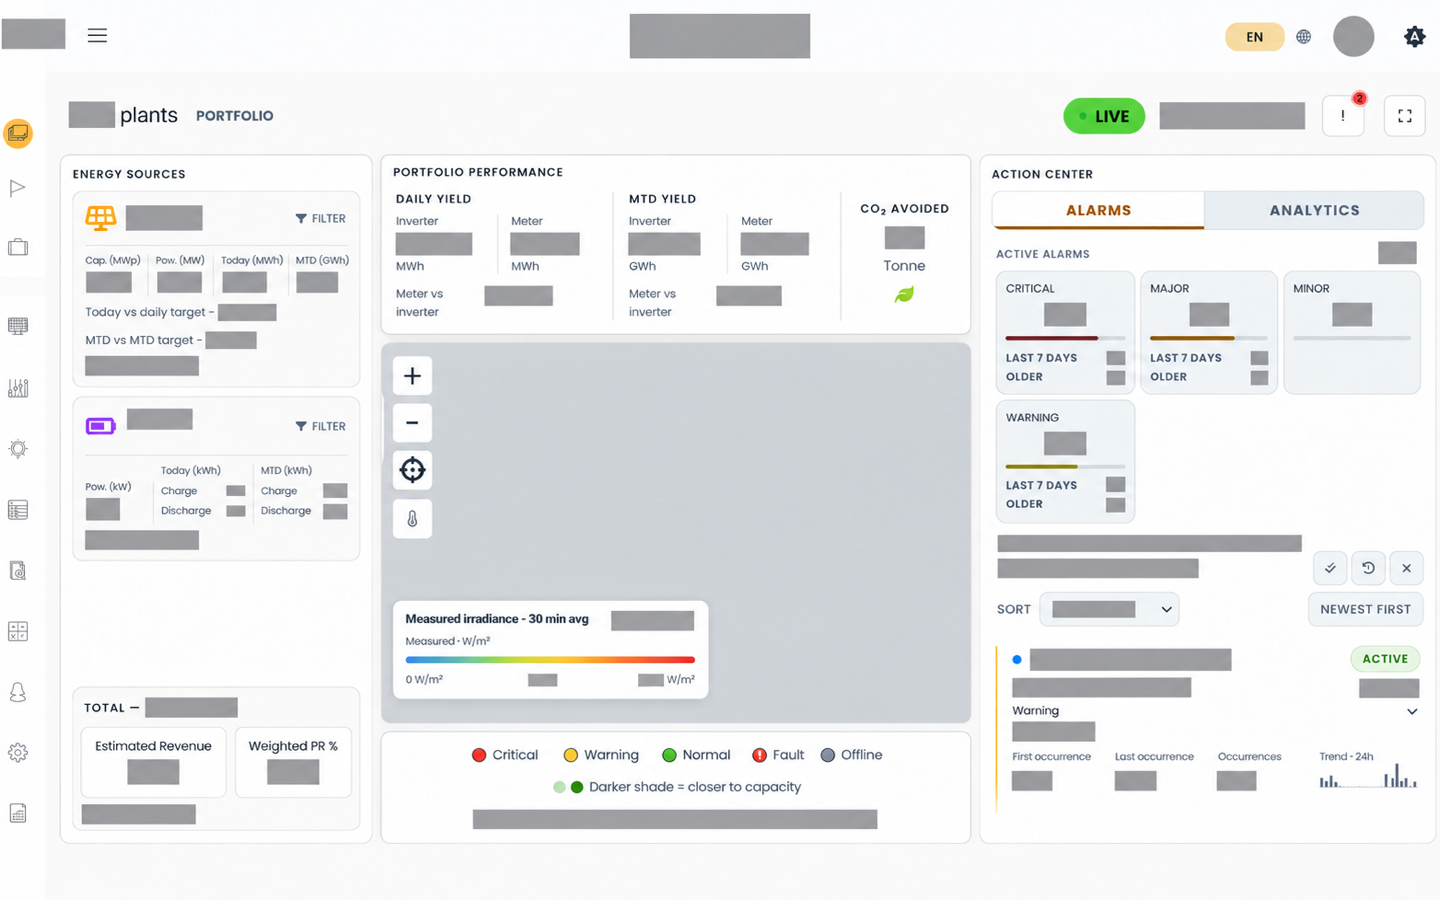
Section titled “Portfolio”Portfolio is the “how are we doing today” view of the whole fleet. It shows:
- estimated revenue
- site status
- production: total power, installed capacity, daily effective yield, budget, overspill energy, and overspill power
- a site table and a map
- portfolio, country, and date selectors
Data-quality findings flag results you should not trust yet, such as an invalid inverter-yield result or a missing String snapshot. Investigate those plants first.
Solar PV production compares actual yield with budget for today and month to date, where a budget is set. A variance tells you where to look; open the site to find the cause.
The map can show current weather with playback controls, so you can compare changing conditions with plant locations.
Operation Overview
Section titled “Operation Overview”Operation Overview has four tabs: Overview, Devices, Alarms, and Performance.
Overview: scan sites
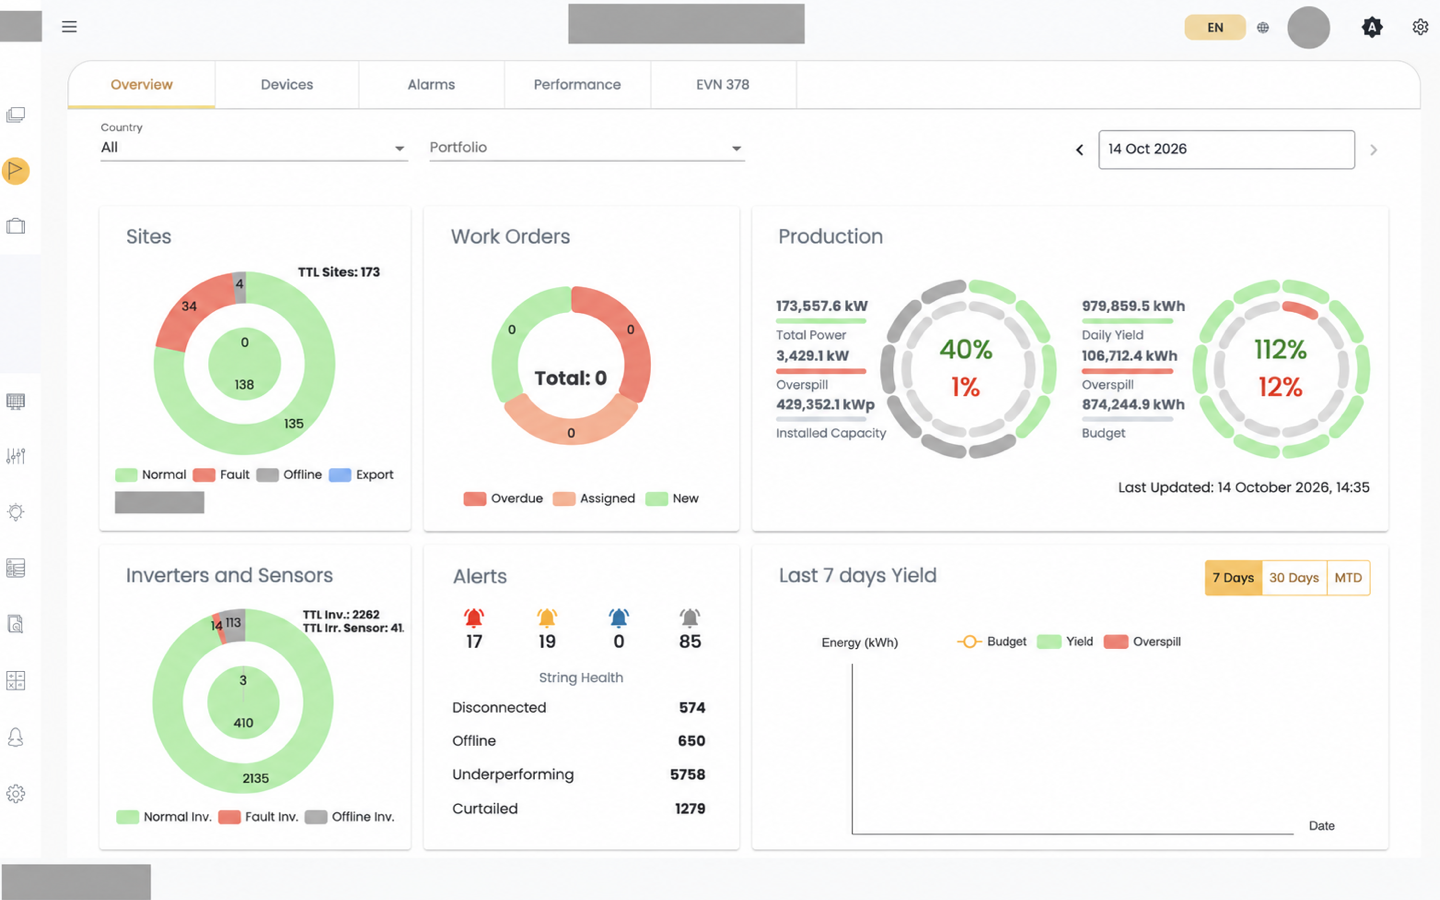
Section titled “Overview: scan sites”The Overview tab has portfolio, country, and date selectors, site status and plant-list views, production cards, alerts, and a yield chart for 7 Days, 30 Days, or MTD. Inverter, sensor, and BESS status views appear where the plant equipment supports them.
The Site Overview table lists each site with its status: Normal, Fault, Offline, or Export, plus device-specific Normal, Fault, and Offline variants. Select a site to open it.
Choose columns. Use Columns to choose which fields appear. Optional performance fields include Total PR and Total Corrected PR where data is available. Exports contain the visible columns in their displayed order, and always include Site Name.
Save a view. Saved Views keeps a combination of columns, sorting, client and brand filters, equipment sorting, portfolio, and country.
- Create up to five named views, and rename or overwrite them.
- Pin up to three beside the Site Overview title for one-click access.
- Unsaved edits are marked, and SolarSENS asks before discarding them.
- The view you used last opens on your other devices too. Choose the default view to get the complete, unfiltered column set.
Storage plants. For storage-enabled sites, the overview can show BESS power, availability, and state of charge. A battery with no current power reading shows as unavailable, not idle. Check its latest-update time before acting on it.
Devices: find equipment to inspect
Section titled “Devices: find equipment to inspect”The Devices tab groups fleet equipment into tabs such as Inverters, Strings, Sensors, AVA Loggers, UPS, Meters, Inverter Station, and SCB. Depending on the group, you can filter by plant and status:
| Device group | Status filters |
|---|---|
| Inverters | All, Normal, Fault, Offline |
| Strings and other devices | All, Disconnected, Offline, Underperforming, Curtailed, Half, Normal |
In the Summary tab, string-status counts are daily classifications for the selected fleet view. Use them to decide which plant to inspect next. They are not a live list of disconnected devices.
| Status | Default score range | What to do |
|---|---|---|
| Disconnected | 0–30% | Open String Analytics and confirm against device status, alarms, and telemetry. |
| Half | 30–60% | Check whether the same strings or inverter area repeat across recent days. |
| Underperforming | 60–80% | Follow up when the count is unusual for that site. |
| Normal | 80–100% | The normal comparison group for the selected result. |
Curtailed and Offline describe status and context. They are not score bands.
If your operation needs different status thresholds, contact AVA support to review the site configuration.
String Analytics shows which strings make up a status count. Its map colours group lower and higher scores, but they do not match the Summary status columns one to one.
Alarms: work the fleet’s alarms
Section titled “Alarms: work the fleet’s alarms”The Alarms tab filters alarms across the fleet by plant, device type, device label, and date range. Each row shows plant, device, device type, alarm type, fault code, status, severity, start time, end time, and actions.
From the table you can expand a row, export to CSV, acknowledge or clear an alarm, or open an Add Work Order form where available. Alarms and work orders are separate records. Alarm Triage covers the full workflow, and Work order lifecycle covers the work-order side.
Performance: compare plants
Section titled “Performance: compare plants”The Performance tab charts portfolio performance by period, with CSV download. Metrics include Specific Yield, PR, PR Corrected, and Actual Yield/Budget, and short periods include Last 3 Days, Last 7 Days, and Last 14 Days.
Compare plants only on the same PR variant. Base PR for one plant against corrected PR for another shows a difference that has nothing to do with performance. Performance ratio calculation explains each variant.
If something looks wrong
Section titled “If something looks wrong”- A value looks out of date, or two views disagree. Data freshness and corrections explains how to tell display time from measurement and calculation time. If many plants stopped updating at once, check System status for an ongoing incident.
- You’re not sure which view owns a number. Where calculated results appear maps each view’s grain and unit.