Plant Monitoring
Plant Monitoring is where you investigate one plant: check its current status, compare blocks, find equipment, and decide whether the issue needs an alarm review, a work order, or a closer analytical look. You usually arrive here by selecting a site in Portfolio and Operation Overview.
Investigate a plant
Section titled “Investigate a plant”- Choose the plant with the plant selector at the top. Switching plants keeps you on the same tab where possible.
- On Overview, check the status and its Last Updated time, then the production and performance cards.
- If one area of the plant looks weak, compare it on Block.
- Find the equipment involved on Digital Twin or Device Overview, then open Devices Details for its faults.
- Review the plant’s Alarms, and create a work order from an alarm where available.
The standard tabs are Overview, Block, Info, Digital Twin, Device Overview, Devices Details, and Alarms. Storage-enabled plants also show BESS, and some accounts see Work Orders or Manage. The tabs and actions you see depend on your account’s access and the plant’s equipment.
Overview: current status and production
Section titled “Overview: current status and production”Overview is a snapshot of the plant’s current production and performance: status, last update, and the key production and performance cards.
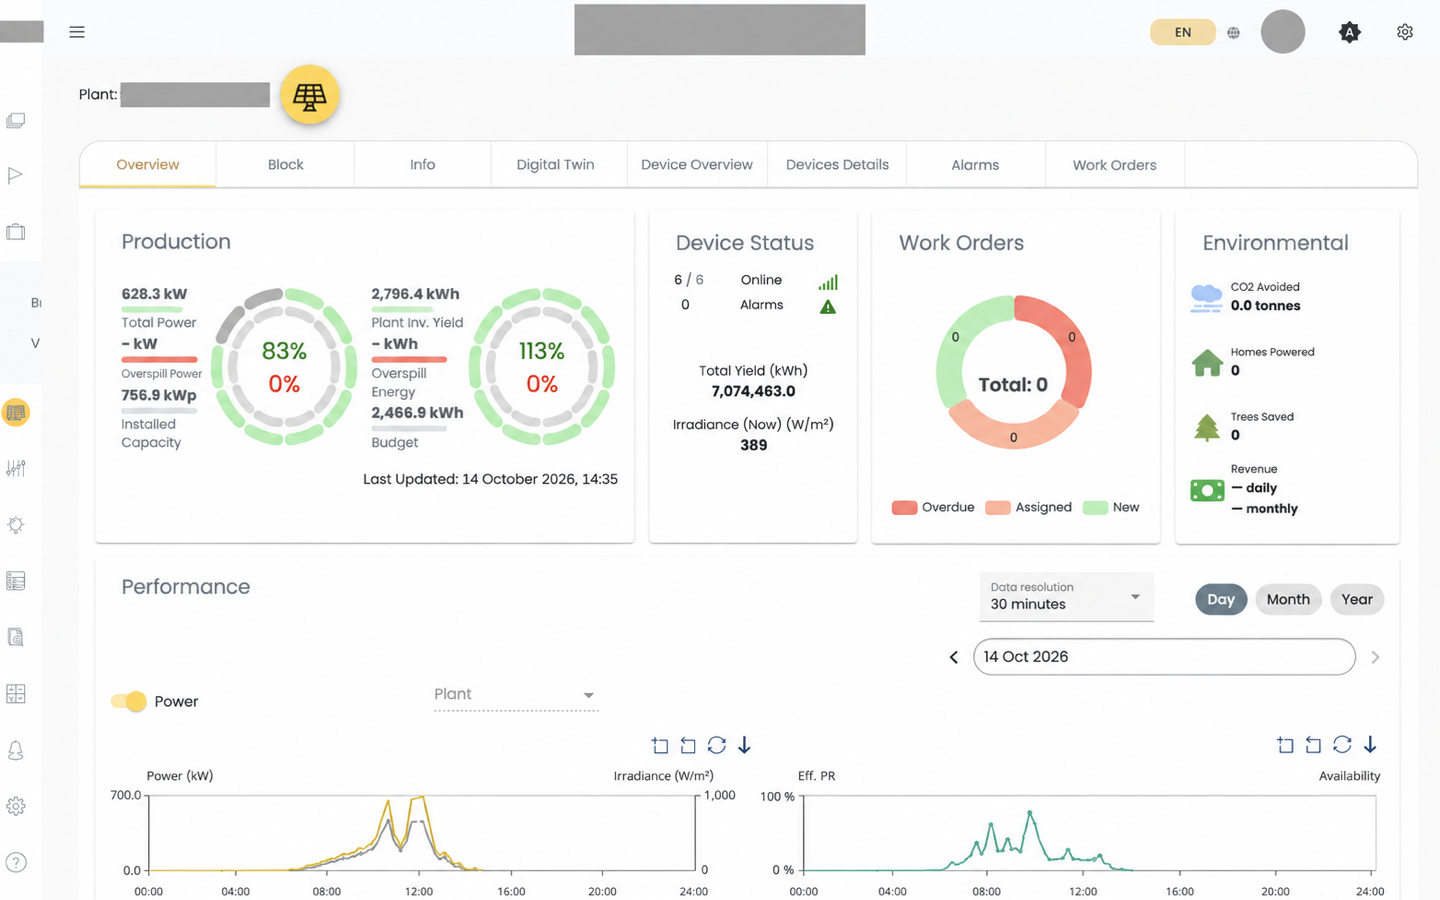
Performance ratio calculation explains how PR and the other KPIs are calculated. Before comparing interval power with daily or monthly energy on the charts, read Interpret load and grid flow.
Look at one power meter
Section titled “Look at one power meter”When a plant has several power meters, use the meter selector beside the chart controls to view one at a time. The page URL keeps your choice, so it comes back when you reopen the page. Switching plant, or choosing a chart combination the meter doesn’t support, resets the selector to the plant level.
| View | What it shows for the selected meter |
|---|---|
| Day + Power | Power at the chosen display resolution |
| Month | Daily yield, irradiance, derating, grid import, grid export, and load energy, where returned |
| Year | The same measures, rolled up by month |
Month and Year are period summaries of energy, not interval power.
For a storage-enabled plant, the Day power view can include BESS active power and fixed-period strategy bands, and Month and Year can include daily or monthly BESS charge and discharge energy. Use the legend and units to tell battery power from accumulated battery energy.
Block: compare parts of the plant
Section titled “Block: compare parts of the plant”Block compares plant blocks side by side. Pick a date and a period (Day, MTD, or Month), then choose a chart: Specific Yield, Yield, PR, Overspill, Soiling, or Unavailability. You can export to CSV. Some options are unavailable for certain blocks or date ranges.
A block that consistently trails its neighbours is a stronger sign of a hardware or wiring problem than a single low PR reading.
Info: plant configuration
Section titled “Info: plant configuration”Info shows plant details, PV details, inverter details, grid tariff, and operation and maintenance details. Where your account allows, you can edit them.
Digital Twin: find a part of the plant
Section titled “Digital Twin: find a part of the plant”Digital Twin shows the plant and device hierarchy with string-level context: string, capacity, current, voltage, tilt, azimuth, and status, with a legend and CSV export. Use it to locate an inverter area or string group before opening device details.
For a comparison across strings, now or historically, open String Analytics.
Device Overview: find a device
Section titled “Device Overview: find a device”Device Overview lists equipment by category: Inverter, Sensor, Logger, Meter, String, Inverter Station, SCB, and UPS. When you already know what you’re looking for, this is faster than browsing Digital Twin, for example to check the status of every inverter.
Devices Details: read a device’s faults
Section titled “Devices Details: read a device’s faults”Devices Details shows device information and fault details: severity, description, alarm start, alarm end, and duration. Confirm the time range before treating a fault as current.
What a device reports here can differ from the calculated comparison in String Analytics. The two can disagree, and that is expected, so check both before deciding on a cause.
BESS: battery units
Section titled “BESS: battery units”For a storage-enabled plant, BESS shows battery units as cards or a list.
- Fleet summary: available unit count, charge or discharge direction, net active power, average state of charge, and latest update, when those readings are available.
- Each unit: active power, state of charge, energy totals, availability, and energy management system status.
A missing power value shows as unavailable, never as idle. Confirm Last Update before treating a state as current, and export to CSV to keep the readings with their timestamp.
Alarms: this plant’s alarms
Section titled “Alarms: this plant’s alarms”The plant Alarms tab is the fleet alarm workflow scoped to one plant. Filter and expand alarm rows, export them, and acknowledge, clear, or Add Work Order where available. Alarm Triage covers the full workflow.
Alarms and work orders are separate records unless your deployment links them. See Work order lifecycle for the work-order side.
Work Orders and Manage
Section titled “Work Orders and Manage”Work Orders and Manage are separate workflows, not telemetry monitoring, and may not be available for your account. For work orders, start with Create and assign.
If something looks wrong
Section titled “If something looks wrong”- This plant’s numbers don’t match an analytical view or a report. Align the grain and unit with Where calculated results appear.
- A value looks stale. Data freshness and corrections explains which part of the value is old. If many plants stopped updating at once, check System status for an ongoing incident.